Solar Energy Scorecard
April 30, 2012
The US installed base of
solar energy generating capacity has been increasing at an accelerated pace. This news is a respite from the gloom and doom we see in recent reports on
solar panel manufacturing.[1-3] Most of the business problems of solar panel companies stem from the recent influx of
Chinese solar energy products.
China was not active in solar energy a few years ago, when most US manufacturers started building solar panel plants. China, possibly as the result of
government subsidies, has had an astounding growth rate in solar
technologies, so much so that it now supplies about half of its
materials and
components internationally.
Chinese manufacturers have been accused of "
dumping" solar products in the US; that is, they're selling them below
cost, but not losing money because of government support. The same thing happened for
integrated circuits many years ago, especially
memory chips. In that case, the suspect country was
Japan.[4] Dumping may be unfair to US suppliers, but it's likely been a boon to solar energy users.
Everyone hoping for the
price of
solar panels to fall well below the
mythical dollar-per-watt level should cheer; provided, however, that the current price reductions aren't a prelude to subsequent price increases after most
competition has been shut out of the
market.
Polysilicon wafers, used for manufacture of the most
efficient,
silicon solar panels, sold for $475/
kilogram in 2008, $78.46/kilogram a year ago, and $24.27/kilogram, today.[1] About a quarter of the price of silicon solar panels is from the cost of polysilicon.[2]
There are reports that the average spot price for polysilicon will fall as low as $22.10/kilogram at year's end.[2] According to
Bloomberg, prices might dip as low as $18/kilogram as companies in financial distress because of few sales will dump their
inventory.[2]

Cookie wafers sell for about $8-$12 per kilogram.
This is just half the present price of polysilicon wafers.
(Via Wikimedia Commons))
The second-largest polysilicon producer in
Europe,
Renewable Energy Corporation ASA, has been forced to close two of its
Norway polysilicon plants in a span of five weeks. These plants had a combined production capacity of 950
megawatt/
year.[3] Renewable Energy still maintains a plant in
Singapore with 700 megawatt/year polysilicon wafer capacity. This plant makes solar cells and panels in addition to polysilicon wafers.[3]
The
Solar Energy Industries Association released its 2011
statistics on the state of solar energy in the US in March, 2012.[5-6] The doom and gloom in the US manufacturing sector is not mirrored in solar installations, since 2011 was a record year for these. There was an additional 1.855
gigawatts of
photovoltaic capacity installed last year, 109% higher than 2010. 776 megawatts were installed in the fourth quarter of 2011. The U.S. now has over 4.460 gigawatts of installed solar electric capacity.[5]
It must be realized, however, that much of this growth was likely fueled by
tax incentives. The so-called "Section 1603 Treasury Program" expired on December 31, 2011. I think that tax incentives are an important part of an overall US
renewable energy strategy, and it would be unfortunate if such incentives disappear. They help mitigate the long
payback period for any renewable energy investment. The halving of solar panel prices during 2011 must have helped as well.[6]
There were twenty-eight solar projects larger than ten-megawatts in 2011, up two from 2010.[6] In all, there were 61,000 individual solar projects completed in 2011.[6] My own state of
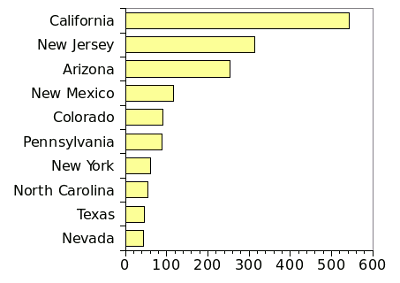
New Jersey ranked second among the US states in additional installed solar capacity in 2011.
California ranked first by quite a margin, as shown in the following table and figure based on data supplied by the
Solar Energy Industries Association.
Top Ten States for Photovoltaic Solar Installations
2011 |

2011 installed solar capacity (megawatts).
Rendered by (Gnumeric) from Solar Energy Industries Association data)
One megawatt of installed solar capacity is considered enough to power about 200
homes. If the
Sun would shine all the time, an installed megawatt would power about 750-1000 homes.[6]
Wind power has an advantage, since it's a solar renewable that functions both
day and
night, albeit sporadically. California may rank as number one, but its solar base amounts to less than a percent of the state's
electrical power.[6]
References:
- Justin Doom, "First Solar Reaches Record Low as Analyst Questions Model," Bloomberg News, April 23, 2012.
- Marc Roca, "Solar Silicon Falling 9% Widens Slump That Hit Solyndra," Bloomberg News on Business Week, April 24, 2012.
- Ehren Goossens, "REC Closing Norway Solar Wafer Plant on China Competition," Business Week, April 24, 2012.
- XX Douglas A. Irwin, "The U.S.-Japan Semiconductor Trade Conflict," in The Political Economy of Trade Protection (1996), Anne O. Krueger, Editor, National Bureau of Economic Research/University of Chicago Press, pp. 5-14; available as a PDF file.
- Solar Energy Facts: Year In Review 2011, Solar Energy Industries Association .
- Dana Hull, "Solar installations doubled last year, with California leading the way," Mercury News, March 13, 2012.
Permanent Link to this article
Linked Keywords: Solar energy; solar panel; manufacturing; China; Chinese; government subsidy; technology; material; component; dumping; cost; integrated circuit; Dynamic random-access memory; DRAM; memory chip; Japan; price; solar panel; myth; mythical; price per watt; dollar-per-watt; competition; market; polysilicon wafers; energy conversion efficiency; silicon; kilogram; Bloomberg; inventory; cookie wafers; Wikimedia Commons; Europe; Renewable Energy Corporation ASA; Norway; megawatt; year; Singapore; Solar Energy Industries Association; statistics; gigawatt; photovoltaic; tax incentive; renewable energy; strategy; payback period; New Jersey; California; Arizona; New Mexico; Colorado; Pennsylvania; New York; North Carolina; Texas; Nevada; Gnumeric; home; Sun; wind power; daytime; night; electrical power.