Geomagnetic Alignment of Cattle
February 11, 2011
It appears that
statistical analysis has become a current topic on this blog. That might be because so many
scientific papers rely on a statistical analysis of data. In a
previous article (The North Side of the Cow, September 03, 2008), I reported on the interesting finding that showed that
cows tend to point north, or maybe south, but not in between [1-3]. This was found in an analysis of
Google Earth images of 308
pastures and 8,510
grazing and resting
cattle by
Sabine Begall and
Hynek Burda of the
University of Duisburg-Essen, Germany, and a research team from the
Czech Republic. They weren't able to tell the head from the tail end of the cows from these images, but the cattle aligned themselves mostly (60-70%) in a north-south direction.
The same effect was observed for 2,974 grazing and resting
red and
roe deer at 241 localities.[3] In that case, the head orientation could be observed, and it was found that the deer tend to point their heads northward. These results were somewhat believable; first, because the paper was published in the
Proceedings of the National Academy of Sciences;[3] and because a variety of
animals from
bees to
bats have been found to be sensitive to the
Earth's magnetic field. Science, of course, is built on a foundation of reproducibility, so it's no wonder that there's been a follow-up study.[4] The follow-up study did not confirm the effect.
The follow-up study, by researchers in the Czech Republic, examined 232 herds with 3,412 cattle. The analysis was done by two independent groups, and no alignment of cattle along
geomagnetic field lines was found. The authors write that the poor resolution of the
Google satellite photographs, as well as a possible subconscious
bias and other technical factors, may have been the reason for the prior positive result. Of course, there are the usual problems of a statistical study, as the authors note.[4]
To obtain a sufficient number of observations to allow statistically significant conclusions, a large amount of data - usually considerably dispersed and sometimes contradictory - needs to be collected. This may be expensive and time-consuming.
To show how easily too little data can mislead, examine the following photograph from the supplemental materials of the recent study.[5]
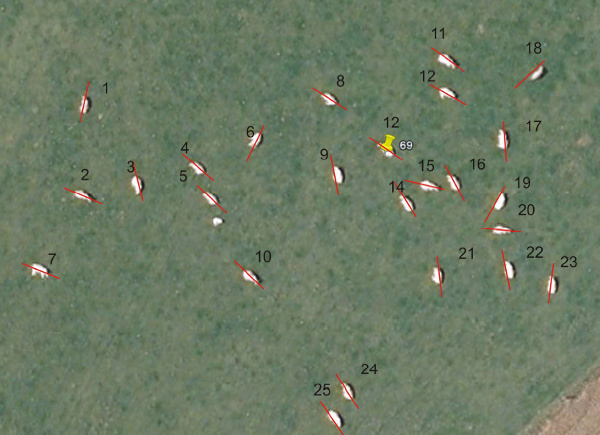
A herd of cattle at pasture at N54°57'8'', E-1°46'26''. From Ref. 4.
If we analyze just this particular herd, it appears that there's a strong inclination for the cattle to orient in a particular direction, as the histogram shows.
Histogram showing the orientation of the herd of cattle at pasture in the above photograph.
Analysis using Gnumeric
In statistics, the
standard error scales as the
reciprocal of the
square root of the number of samples. What this means is that your statistics should change only when you significantly change your sample size. The initial study was on 308 images and 8,510 cattle. The follow-up study was on 232 images and 3,412 cattle. Whether you focus on images or number of cattle, the follow-up study had a smaller sample. If it were just statistics that's the problem, there shouldn't have been a difference, since the ratio of the square root of the sample size is close to one. That's why the authors of the newer study are able to claim technical errors for the prior study.
One essential difference between the two studies is that one used cattle as the basic entity, and the other chose
herds. The original study tabulated the mean directional
vector of each herd for their analysis; the follow-up study looked at the direction of each of the cattle separately. If the follow-up study were recast in terms of the original study, it would have both a vector and an
amplitude associated with each herd. The amplitude would be the number of cattle in the herd.
As the authors of the follow-up study point out, a single cow would be given the same weight as a herd of a hundred cows in the original study. Also, in assigning a direction to a herd, if 99 cattle were randomly distributed, but one of the cattle were pointing in a particular direction, the entire herd of a hundred would have been assigned that direction in the original study. You can see how this could affect the result.
The authors of the follow-up study were able to distinguish the head-end from the tail-end of each of the cattle in twenty out of forty
randomly selected herds, and they presented the detailed result shown in the figure, below. A cursory glance will tell you that there isn't a strong case for a preferred pointing direction.
Probability density function drawn for 20 herds randomly selected from 40 herds
with well resolved positions of heads; and with a similar number of cows. Fig. 3 from Ref. 3.
References:
- Elizabeth Mitchell, "Cattle shown to align north-south" (BBC News, August 25, 2008).
- Randolph E. Schmid, "Cows seem to know which way is north" (Boston.com, August 25, 2008).
- Sabine Begall, Jaroslav Cerveny, Julia Neef, Oldrich Vojtcch, and Hynek Burda, "Magnetic alignment in grazing and resting cattle and deer," Proc. Natl. Acad. Sci., vol. 105, no. 36 (September 9, 2008), pp.13451-13455.
- J. Hert, L. Jelinek, L. Pekarek and A. Pavlicek, "No alignment of cattle along geomagnetic field lines found," arXiv Preprint Server, February 1, 2011.
- J. Hert, L. Jelinek, L. Pekarek and A. Pavlicek, Supporting Materials for "No alignment of cattle along geomagnetic field lines found," arXiv Preprint Server, February 1, 2011.
Permanent Link to this article
Linked Keywords: Statistical analysis; academic publishing; scientific papers; cattle; cows; Google Earth; pasture; graze; Sabine Begall; Hynek Burda; University of Duisburg-Essen, Germany; Czech Republic; red deer; roe deer; Proceedings of the National Academy of Sciences; animal; bees; bats; Earth's magnetic field; geomagnetic field lines; Google satellite photographs; bias; N54°57'8''; E-1°46'26''; Gnumeric; standard error; reciprocal; square root; herd; vector; amplitude; random sample.