2014 Science and Engineering Indicators
February 17, 2014
William Thomson, not to be confused with another
physicist,
Benjamin Thompson (a.k.a., Count Rumford), is known to
scientists as Lord Kelvin. Kelvin is famous for many things, but most notably for his work on
thermodynamics, for which he is honored by the naming of the
kelvin temperature unit. Kelvin is
quoted as saying.
"I often say that when you can measure what you are speaking about, and express it in numbers, you know something about it; but when you cannot express it in numbers, your knowledge is of a meagre and unsatisfactory kind..."[1]

This
maxim is true not only for the practice of science, but in the setting of science policy by governments. Although it appears that no one in government is listening, there have been many studies showing that the payback for investment in science and technology far outweighs its cost.
The National Science Board, the policy-making body of the National Science Foundation, released its recent biennial report on the status of United States science and technology. This report, Science and Engineering Indicators 2014, indicates that the US still leads in science and technology areas, but its lead is shrinking.[2-3]
We need only to look at the present examples of Apple and
Google to see that science and technology are important
economic drivers. This month, Google's
market capitalization passed $400 Billion, just behind the little more than $450 Billion of Apple.[4]
Innovation in science and technology contributes to national
competitiveness. As a consequence, it improves
living standards. The world economies are moving towards a larger fraction of so-called
knowledge- and technology- intensive (KTI)
industries. This trend is evident in figure, below.

The knowledge- and technology- intensive industries portion of the gross domestic product (GDP, %) for the past decade for five representative countries/economic unions. (From the Overview of the 2014 Science and Engineering Indicators.)[5)]
Not surprisingly,
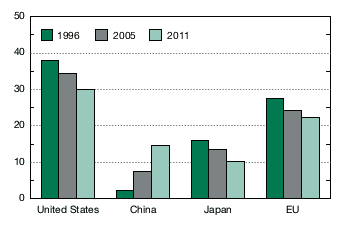
China's share of the world's R&D expenditures has been increasing, mirrored as a decrease in R&D share for the rest of the world (see figure). China's manufacturing of technology goods increased nearly six-fold between 2003 and 2012. China now manufactures 24% of worldwide technology goods, close to the U.S. share of 27%.[3]

Global share of R&D expenditures.
(From the Overview of the 2014 Science and Engineering Indicators.)[5]
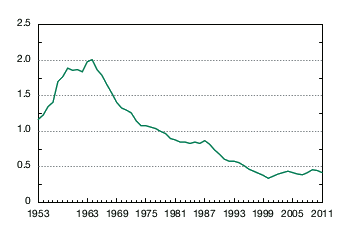
The government share of R&D has been declining in the U.S. since the mid-
1960s. The present ratio of U.S.
federal-to-nonfederal funding for R&D has declined to a quarter of its peak value. One consequence of this is that the
2007-2008 financial crisis and
subsequent recession caused a sharp drop in business R&D in the U.S., and this amounted to a large drop in total R&D.[3]

Ratio of U.S. federal-to-nonfederal funding for R&D, 1953–2011
(From the Overview of the 2014 Science and Engineering Indicators.)[5]
The U.S. has rebounded from the recession better than other countries, so much so that 2011 saw a return to 2008 funding levels for R&D. Although it is not apparent from my
anecdotal evidence, science and technology jobs were more secure in the recession than other jobs. U.S.
multinational corporations apparently perform more than 80% of their R&D in the U.S., but they're moving their research to such countries as
Brazil, China, and
India.
Since 2001, the U.S. share of worldwide R&D has declined from 37% to 30%, and that of
Europe from 26% to 22%, while the worldwide R&D share for
Asian countries grew from 25% to 34%. China's worldwide R&D share was just 4% in 2001, and it's nearly quadrupled today.[3] China's science and technology workforce tripled between 1995 and 2008, and
South Korea's doubled from 1995-2006.[3]

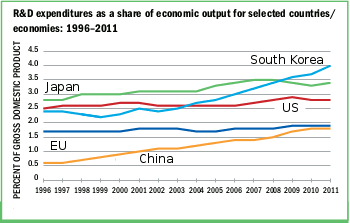
Asia rising.
R&D expenditures as a percent of gross domestic product (GDP).
(From the Digest of the 2014 Science and Engineering Indicators.)[6]
Says National Science Board
Chairman,
Dan Arvizu,
"Emerging economies understand the role science and innovation play in the global marketplace and in economic competitiveness and have increasingly placed a priority on building their capacity in science and technology."[3]
This assessment is amplified by National Science Board member and chairman of its Committee on Science and Engineering Indicators,
Ray Bowen.
"The United States remains the world's leader in science and technology... but there are numerous indicators showing how rapidly the world is changing and how other nations are challenging our predominance. As other countries focus on increasing their innovation capacities, we can ill afford to stand still. We now face a competitive environment undreamed of just a generation ago."[3]
The U.S. has slipped to tenth place in world R&D, as measured by the percentage of its
gross domestic product (GDP) used to fund research. Dollar-wise, however, the US is still a leader, having spent $429 billion on R&D in 2011, as compared to China's $208 billion and
Japan's $146 billion. The U.S. leads, also, in
patents, income from
intellectual property exports, and
publications in the most notable
journals.[3]
References:
- "You cannot manage what you cannot measure," Quotations and Literature Forum.
- Science and Engineering Indicators 2014, National Science Board.
- US lead in science and technology shrinking, National Science Foundation Press Release No. 14-022, February 6, 2014.
- Science and Engineering Indicators 2014, Overview (PDF File).
- Science and Engineering Indicators 2014, Digest (PDF File).
- Roben Farzad, "Google at $400 Billion: A New No. 2 in Market Cap," Business Week, February 12, 2014.
Permanent Link to this article
Linked Keywords: William Thomson, 1st Baron Kelvin; physicist; Benjamin Thompson; scientist; thermodynamics; kelvin; maxim; science; science policy; government; technology; National Science Board; National Science Foundation; United States; Apple; Google; economy; economic driver; market capitalization; competitiveness; standard of living; living standard; knowledge economy; industry; gross domestic product; GDP; 2014 Science and Engineering Indicators; China; 1960s; federal government of the United States; 2007-2008 financial crisis; Great Recession; recession; anecdotal evidence; multinational corporation; Brazil; India; Europe; Asian; South Korea; chairman; Dan Arvizu; Ray Bowen; Japan; patent; intellectual property; export; publication; scientific journal; "You cannot manage what you cannot measure."