Threshold Earthquakes
June 17, 2019
Earthquakes are rare in
Northern New Jersey, the home of
Tikalon. That's why I decided that there was something wrong with the
wheels of my
office chair when I was shaken from my
spreadsheet-induced
stupor in the
afternoon of August 23, 2011. While I was examining the chair, the
doors of my
filing cabinet began to shake and I felt the
Earth move. These were the effects of the 5.8
magnitude Virginia earthquake whose
epicenter was 300
miles distant.
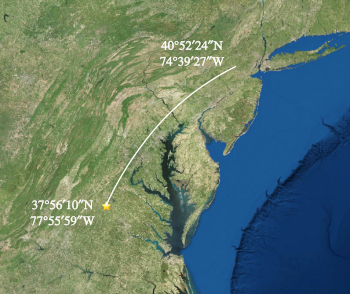
The epicenter of the August 23, 2011, Virginia earthquake, marked by the star, was at 37° 56' 10" North Latitude, 77° 55' 59" West Longitude, about 300 miles from Tikalon's Northern New Jersey home.
(Base map from the United States Geological Survey, modified using Inkscape. Click for larger image.)
While this earthquake was potentially felt by about a quarter of the
US population, principally because the affected region is heavily populated, this earthquake was more of a nuisance than a
disaster. There were no
fatalities, and the
damage is estimated to be less than $300 million. That's a consequence of the earthquake's having the relatively low
magnitude of 5.8.
Earthquake magnitudes are calculated using the
moment magnitude scale, an improvement of the
Richter magnitude scale that was commonly used in the
20th century. The moment magnitude,
Mw is calculated as
Mw = 2/3 log10(M0) - 10.7
where
M0 is the
seismic moment in units of
dyne-
cm (10
−7 N-m). The
scaling factor of
2/3 and the
offset of
10.7 are selected to make values on the moment magnitude scale closely conform to those on the Richter magnitude scale.
Since the moment magnitude scale is a
logarithmic scale, a change in value of a single unit signals a considerable increase in an earthquake's damage potential. This is demonstrated in recent history by the
2011 Tōhoku earthquake and its resultant tsunami. That 9.0 magnitude quake killed more than 10,000 people, and it also resulted in the
Fukushima Daiichi nuclear disaster when the
tsunami interrupted
power to the
reactor cooling systems and caused
reactor core meltdowns.
Physicist,
Richard Feynman, so aptly said, "
There's plenty of room at the bottom." Below the devastation of a 9.0 magnitude earthquake and the annoyance of a 5.0 magnitude earthquake are a multitude of lesser earthquakes, many of which are not felt by
humans and just barely register on
sensitive seismometers. Earthquake magnitudes follow a
power law distribution in which smaller earthquakes occur much more often than larger earthquakes. There are about a million earthquakes at magnitude 2.5 and below that are not felt but happen each year.[1] On February 2, 2009, a magnitude-3.0 earthquake occurred with an epicenter just seven miles from Tikalon's home, and it passed unnoticed.
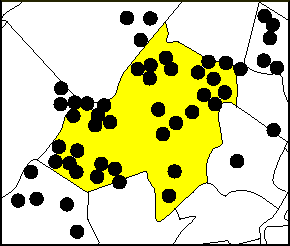
Cataloged earthquakes in Tikalon's Morris County, New Jersey, home.
All these earthquakes are less than 3.4 magnitude.
New Jersey State Geological Survey image.)
This
seismics background is so large that
seismic isolation is required to allow the proper functioning of the
Laser Interferometer Gravitational-Wave Observatory (LIGO) that's designed to detect the very faint vibrations of
space produced by
gravitational waves. Multiple levels of
isolation are needed to allow LIGO's detection sensitivity of 10
-19 meter. For comparison, the
ground slip for a magnitude 9 earthquake is several tens of meters.
Earthquake affects are found at considerable distances from the epicenter. While the
mechanical effects of earthquakes propagate at the
speed of sound, the a href="https://en.wikipedia.org/wiki/Gravitation">gravity effects travel at the
speed of light.
Acceleration from gravity change were observed in
China and
South Korea immediately after the Tohoku earthquake.[2] This leads to the idea that gravity signals can be used as an rapid-warning that earthquakes have begun.[3] While such a rapid warning would be welcome,
scientists have struggled to find an
effective indicator that an earthquake is pending long before the event, and I've detailed
historical approaches in an
earlier article (Earthquake Prediction, February 18, 2011).
In 1989,
Stanford University electrical engineer, Antony Fraser-Smith, made the chance observation that the
Loma Prieta earthquake produced
high intensity ULF radio signals in the days prior to the quake.[4] Three hours before this earthquake, the ULF signal was 20-30 times larger than the typical signal level.[4]
Correlation of low frequency
electromagnetic activity and
seismic activity has been documented in
satellite observations.[5-7]
While all prediction methods based on a single effect have proven ineffective, there's the idea that a combination of observations might yield earthquake prediction using
pattern recognition. This method was pioneered by
Russian mathematical physicist and
seismologist,
Vladimir Keilis-Borok (1921-2013). While earthquake swarms are thought to be one possible indicator of an impending destructive earthquake, their predictive strength is just as weak as any other single indicator.[7-8] More data on background seismicity might still be helpful for the pattern recognition approach.
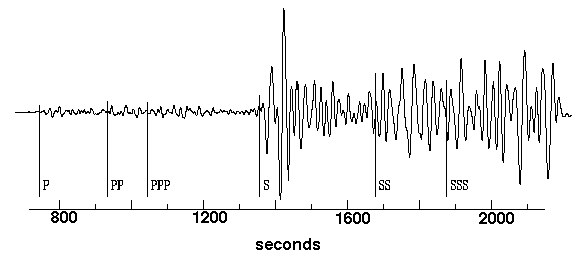
Half a world away - Seismogram of the 1906 San Francisco earthquake, as recorded in Göttingen, Germany. (image via the USGS website.)
A team of
geoscientists from the
California Institute of Technology (Pasadena, California),
Los Alamos National Laboratory (Los Alamos, New Mexico), and the
Scripps Institution of Oceanography (La Jolla, California) have just
published a study of the occurrence of tiny earthquakes that occurred over a recent 10-year period in
Southern California.[10-14] Their
data were collected from about 400 seismic
sensors. From 2008 to 2017, they detected 1.81 million such tiny earthquakes in that region, a ten-fold increase in number over previous measurements. This detection was made despite seismic interference from
environmental noise sources such as
road vehicles,
building construction, and
ocean waves.[10-13]
This
Mining Seismic Wavefields research project began in 2016 to examine the entire continuous
dataset of the
Southern California Seismic Network.[12] The
data analysis was enabled by a
computer cluster of 200
graphics processing units housed at Caltech for tens of thousands of hours of initial data screening followed by hundreds of thousands of hours of
computation on other
computers.[11,13] The method used to overcome the low
signal-to-noise ratio was
template matching in which the data were selected based on
waveforms of known earthquakes.[10-11] Template matching works best when
cross-correlations can be made between sensors located within 2 miles of each other.[11]
The essential problem that template matching solves is to distinguish such small earthquakes from the background noise.[12] This was only possible through a
machine-learning system trained with millions of examples of both real earthquake signals and other vibrations.[12] Says Caltech's
Zachary Ross, lead
author of the study, "It's not that we didn't know these small earthquakes were occurring. The problem is that they can be very difficult to spot amid all of the noise."[11] Borrowing waveform analysis techniques from
audio signal processing, the team developed an
algorithm called FAST (Fingerprinting and Similarity Thresholding).[12]
The analysis revealed that there are about 495 earthquakes daily across Southern California, and these occur at an average interval of about three minutes.[11] The previous estimate was that earthquakes occur about 30 minutes apart.[11] This 10-fold increase in number arises from the study's detection of earthquakes in the -2.0 to 1.7 range.[11]
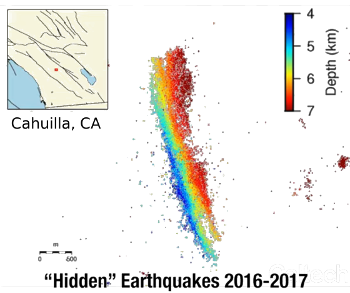
Seismic swarm activity associated with the Cahuilla earthquake in Southern California's Anza Valley.
Template matching shows the swarm of small earthquakes from 2016-2017 in greater detail with the color of each seismic event indicating its depth.
The gradient of depth indicates the shallow-to-deep slant of the fault that was not apparent from earlier data.
(Still image from a California Institute of Technology YouTube Video.[14] Click for larger image.)
The expanded earthquake catalog reveals
foreshocks of major earthquakes that were previously undetected and the evolution of
swarms of earthquakes.[11] This analysis technique could also be used to study
slow slip that progresses over a time period of months to years, and it might also be useful for earthquake prediction.[12-13] This research was funded by the
National Science Foundation and the
United States Geological Survey.[11]
References:
- Earthquake Magnitude Scale, Michigan Tech UPSeis Program Website.
- Larry O'Hanlon, "Seeing the gravitational waves, despite the seismic waves," Earth & Space Science News, vol. 97 (February 17, 2016), doi:10.1029/2016EO046251.
- Alexandra Witze, "Gravity signals could speedily warn of big quakes and save lives," Nature News, November 30, 2017, doi:10.1038/nature.2017.23045.
- Scientists debate new evidence for electromagnetic earthquake predictors, Stanford University News Service, December 31, 1991.
- F. Muto, M. Yoshida, T. Horie, M. Hayakawa, M. Parrot, and O. A. Molchanov, "Detection of ionospheric perturbations associated with Japanese earthquakes on the basis of reception of LF transmitter signals on the satellite DEMETER," Natural Hazards and Earth System Sciences, vol. 8, no. 1 (February 26, 2008), pp. 135-141.
- A. Rozhnoi, M. Solovieva, O. Molchanov, P.-F. Biagi, M. Hayakawa, K. Schwingenschuh, M. Boudjada, and M. Parrot, "Variations of VLF/LF signals observed on the ground and satellite during a seismic activity in Japan region in May-June 2008," Natural Hazards and Earth System Sciences, vol. 10, no. 3 (March 16, 2010), pp. 529-534.
- M. Athanasiou, G. Anagnostopoulos, A. Iliopoulos, G. Pavlos and K. David, "Enhanced ULF radiation observed by DEMETER two months around the strong 2010 Haiti earthquake," arXiv Preprint Server, December 7, 2010.
- V. I. Keilis‐Borok, L. Knopoff, I. M. Rotvain, and T. M. Sidorenko, "Bursts of seismicity as long‐term precursors of strong earthquakes, Journal of Geophysical Research: Solid Earth, vol. 85, no. 82 (February 10, 1980), pp. 803-811, https://doi.org/10.1029/JB085iB02p00803.
- Prelude to the Big One?, Seismo Blog, Berkeley Seismological Laboratory, October 26, 2015 .
- Zachary E. Ross1, Daniel T. Trugman, Egill Hauksson, and Peter M. Shearer, "Searching for hidden earthquakes in Southern California," Science, vol. 364, no. 6442 (May 24, 2019), pp. 767-771, DOI: 10.1126/science.aaw6888. A PDF file of supplementary material is available here.
- Robert Perkins, "Scientists Identify Almost 2 Million Previously "Hidden" Earthquakes," Caltech Press Release, April 18, 2019.
- Robin Andrews, "Algorithms spot millions of California’s tiniest quakes in historical data," Nature News, April 18, 2019.
- Rebecca Hersher, "Tiny Earthquakes Happen Every Few Minutes In Southern California, Study Finds, NPR, April 18, 2019.
- Hidden Earthquakes in Southern California, Caltech YouTube Video, April 18, 2019.
Linked Keywords: Earthquake; Northern New Jersey; Tikalon; wheel; office chair; spreadsheet; stupor; afternoon; door; filing cabinet; Earth; magnitude; Virginia earthquake; epicenter; mile; North Latitude; West Longitude; United States Geological Survey; Inkscape; United States population; disaster; death; fatality; damage; moment magnitude scale; Richter magnitude scale; 20th century; seismic moment; dyne; centimeter; Newton meter; scale factor; parallel curve; offset; logarithmic scale; 2011 Tōhoku earthquake and its resultant tsunami; Fukushima Daiichi nuclear disaster; tsunami; electric power; reactor cooling system; reactor core meltdowns; physicist; Richard Feynman; There's plenty of room at the bottom; human; sensitivity (electronic); seismometer; power law distribution; Morris County, New Jersey; New Jersey State Geological Survey; seismic wave; seismic; vibration isolation; seismic isolation; Laser Interferometer Gravitational-Wave Observatory (LIGO); spacetime; space; gravitational wave; fault (geology); ground slip; classical mechanics; mechanical effect; speed of sound; speed of light; acceleration; China; South Korea; scientist; earthquake prediction; history; historical; Stanford University; electrical engineer; Loma Prieta earthquake; intensity (physics); ultra-low frequency; ULF radio signal; correlation; electromagnetic field; seismology; remote sensing; satellite observation; pattern recognition; Russian; mathematical physicist; seismologist; Vladimir Keilis-Borok (1921-2013); seismogram; 1906 San Francisco earthquake; Göttingen, Germany; geophysics; geoscientist; California Institute of Technology (Pasadena, California); Los Alamos National Laboratory (Los Alamos, New Mexico); Scripps Institution of Oceanography (La Jolla, California); scientific literature; publish; Southern California; data; sensor; environment; motor vehicle; road vehicle; building construction; ocean wave; Mining Seismic Wavefields research project; dataset; Southern California Seismic Network; data analysis; computer cluster; graphics processing unit; computation; computer; signal-to-noise ratio; template matching; waveform; cross-correlation; machine-learning system; Zachary Ross; author; audio signal processing; algorithm; Cahuilla earthquake; seismic swarm; Cahuilla, California; Anza Valley; gradient; foreshock; slow earthquake; slow slip; National Science Foundation; United States Geological Survey.