Visualization in Science and Math
June 30, 2016
My
thought processes fall into two modes. As a
background process, I often churn
abstract ideas in my
brain for days, or weeks, at a time. However, when my thoughts are directed at more concrete ideas, I need to scratch things out with
pencil and
paper. In this, I'm following in the
tradition of
Leonardo da Vinci, who left voluminous
notebooks filled with
drawings.
One example is his
helicopter, also called his air screw, as shown in the figure.
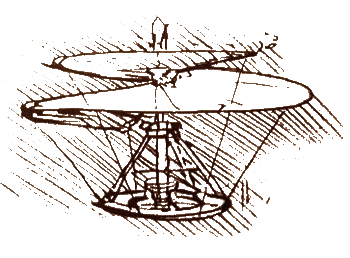
Leonardo da Vinci's helicopter.
Da Vinci, who was a keen observer of nature, may have gotten the idea for this "air screw" from the winged seeds of trees such as the maple.
(Wikimedia Commons image.)
A 2011
article in
Science by
Shaaron Ainsworth of the
University of Nottingham (Nottingham, UK),
Vaughan Prain of
La Trobe University (Bendigo, Australia), and
Russell Tytler of
Deakin University (Waurn Ponds, Australia), cites further examples in the notebooks of
Michael Faraday and
James Clerk Maxwell. Since
scientists use visual representations to
innovate and test new ideas, these
authors propose that
students of
science would be more engaged if their
courses had less of an emphasis on
rote learning, instead having the students
sketch scientific principles.[1]
Electronic engineers specializing in
analog circuit design are always sketching
circuit diagrams in notebooks, and often on
tablecloths and
napkins during
luncheon meetings.
Organic chemists are always sketching potential
molecular configurations.
Roald Hoffmann, who was awarded the 1981
Nobel Prize in Chemistry, has given many examples of
molecular structures in his frequent articles in
American Scientist.[2-3]
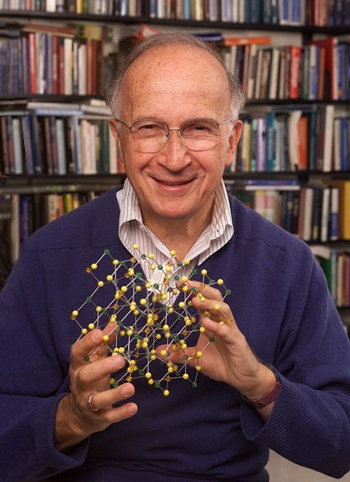
Nobel Chemistry laureate, Roald Hoffmann, holding a ball-and-stick model of a crystal.
Such models have been guiding chemists since the discovery of the atomic nature of matter.
One prominent example is the elucidation of the molecular structure of DNA by James Watson and Francis Crick.
(Via Wikimedia Commons.)
While
geometry, existing for more than two
millennia, has always been a visual part of
mathematics, it wasn't until the
invention of the
Cartesian coordinate system by
René Descartes in 1637 that nearly every part of mathematics became visual. This Cartesian visualization assisted
Isaac Newton and
Gottfried Wilhelm Leibniz in their development of
calculus in the
17th century (see figure).
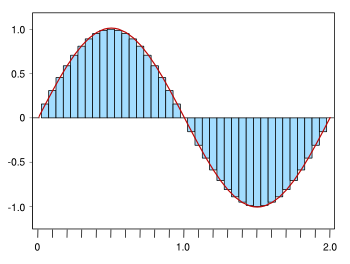
Integral of the sine function, approximation by rectangles. The x-axis is in units of pi.
The area under each half-sine wave is 2, but their sum is zero.
(Created using Gnumeric.)
Computer graphics have aided scientific and mathematical visualization. As I wrote in an
earlier article (Visualizing Science, November 9, 2010), a research team from
Los Alamos National Laboratory used anonymized data from twenty three online
database providers to see how scientists move between articles in different specialty journals. In this way, the Los Alamos team was able to capture 346,312,045 transactions to
map the connections between scientific fields.[4] That's quite an advance over what I could do with
graph paper and a pencil in my student days.
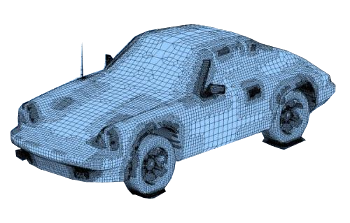
Engineering has been assisted by computer aided design (CAD).
This is a finite element model of a Porsche 911 automobile.
(Modified Wikimedia Commons image.)
The
periodic table of the
elements is usually just a convenient
reference chart, and it's an
iconic wall hanging in most
laboratories. While the typical format of the periodic table, as can be seen on
Wikimedia Commons, has always served me well, scientists have constructed
alternative visualizations to emphasize one property or another. Two interesting examples are shown below.
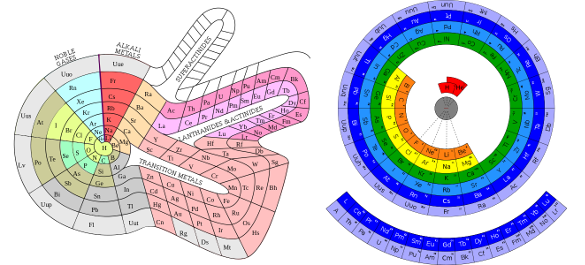
Two spiral format periodic tables. (Click for larger versions of the left and right tables on the Wikimedia Commons Web Site. Left image by DePiep, and right image by Chris Buckley)
While the
prime numbers could constitute a periodic table for mathematics, this would be a large table, indeed, since there are an
infinity of primes. Although there are some
periodicities in the prime numbers, as shown by the
Ulam Spiral, these would be well hidden in a table containing a small
subset of the primes. Now, a team of more than 80
mathematicians from 12
countries has developed a different sort of periodic table of mathematics, and they've launch a website,
www.lmfdb.org, to contain this information.[5-6]
The LMFDB, more properly, the database of
L-functions,
modular forms, and related objects, was developed through thousands of hours of human effort and hundreds of
CPU years.[5] More than 20 million objects are contained in the database, and each item has a link to related items.[5] Says
John Voight, an
associate professor of mathematics at
Dartmouth College and a member of the LMFDB project team,
"Our project is akin to the first periodic table of the elements. We have found enough of the building blocks that we can see the overall structure and begin to glimpse the underlying relationships."
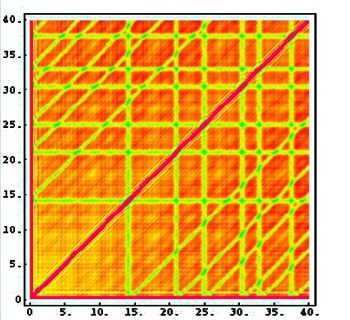
A representation of the triple correlation of the zeros of the Riemann zeta function.
The stripes arise from the influence of the first few zeros on the later zeros.
(Image courtesy of Nina Snaith.)
The motivation for this work is to build connections between apparently unrelated areas of mathematics, as Descartes did when he merged
algebra with geometry in his coordinate system. One modern example is how
Andrew Wiles, in his
proof of
Fermat's Last Theorem, used a connection between
elliptic curves and modular forms.[5]
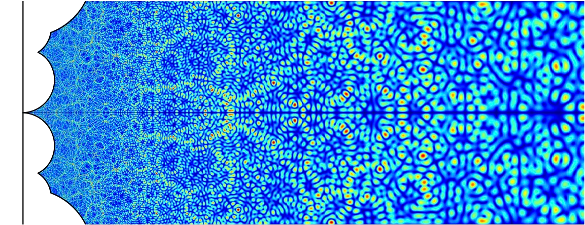
(Image by Fredrik Strömberg.)
Mathematicians are using computers more often for discovery, and the availability of
cloud computing has led to an enhanced capability in this area. As an example,
MIT's Andrew Sutherland used 72,000
cores of the
Google Compute Engine to complete in hours a tabulation that would have required at least a century on a single computer.[5] More than 100
research papers reference the data in the LMFDB.[5]
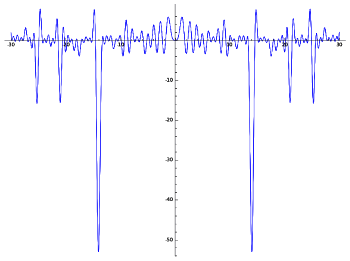
An aural visualization can be done by mapping number values to audio frequencies.
This waveform is the the Z-function of the first rank-4 elliptic curve, rendered in sound in this mp3 file.
(Image courtesy of LMFDB.)
References:
- Shaaron Ainsworth, Vaughan Prain, and Russell Tytler, "Drawing to Learn in Science, Science," vol. 333, no. 6046 (August 26, 2011), pp. 1096-1097. A PDF file of this article can be found here.
- One example, from many, is Roald Hoffmann, "The Many Guises of Aromaticity," American Scientist, vol. 103, no. 1 (January-February 2015), pp. 18ff., DOI: 10.1511/2015.112.18.
- Roald Hoffmann Web Site.
- Johan Bollen, Herbert Van de Sompel, Aric Hagberg, Luis Bettencourt, Ryan Chute, Marko A. Rodriguez and Lyudmila Balakireva, "Clickstream Data Yields High-Resolution Maps of Science," PLoS ONE, vol. 4, no. 3 (March 11, 2009), article e4803, http://dx.doi.org/10.1371/journal.pone.0004803. The scientific field map can be found at this link.
- Exploring the mathematical universe - Uncovering new worlds along the way, American Institute of Mathematics, May 10, 2016.
- LMFDB, the database of L-functions, modular forms, and related objects.
Permanent Link to this article
Linked Keywords: Thought processes; background process; abstraction; abstract; idea; brain; pencil; paper; tradition; Leonardo da Vinci; notebook; drawing; helicopter; nature; winged seeds; tree; maple; Wikimedia Commons; scientific literature; article; Science; Shaaron Ainsworth; University of Nottingham (Nottingham, UK); Vaughan Prain; La Trobe University (Bendigo, Australia); Russell Tytler; Deakin University (Waurn Ponds, Australia); Michael Faraday; James Clerk Maxwell; scientist; innovation; innovate; author; student; science; course; rote learning; sketch; scientific law; scientific principle; electronic engineering; electronic engineer; analog signal; circuit design; circuit diagram; tablecloth; napkin; lunch; luncheon; meeting; organic chemistry; organic chemist; molecular geometry; molecular configuration; Roald Hoffmann; Nobel Prize in Chemistry; molecular structure; American Scientist; Nobel Chemistry laureate; ball-and-stick model; crystal; chemist; atomic theory; atomic nature of matter; DNA; James Watson; Francis Crick; geometry; millennia; mathematics; invention; Cartesian coordinate system; René Descartes; Isaac Newton; Gottfried Wilhelm Leibniz; calculus; 17th century; integral; sine function; approximation; rectangle; abscissa; x-axis; pi; area; summation; sum; Gnumeric; computer graphics; Los Alamos National Laboratory; anonymity; anonymize; data; database; map of connections between scientific fields; graph paper; engineering; computer aided design (CAD); finite element method; finite element model; Porsche 911 automobile; periodic table; chemical element; reference chart; cultural icon; iconic; wall hanging; laboratory; alternative periodic table; spiral; DePiep; Chris Buckley; prime number; Euclid's theorem; infinity of primes; periodic function; periodicity; Ulam Spiral; subset; mathematician; country; lmfdb.org; L-function; modular form; central processing unit; CPU; John Voight; associate professor; Dartmouth College; correlation; Riemann hypothesis; zeros; Riemann zeta function; Nina Snaith; algebra; Andrew Wiles; mathematical proof; Fermat's Last Theorem; elliptic curve; Maass wave form; Fredrik Strömberg; cloud computing; Massachusetts Institute of Technology; MIT; Andrew Sutherland; multi-core processor; core; Googles Compute Engine; scientific journal; esearch paper; aural; mapping; audio frequency; waveform; Z-function; sound; mp3 file; LMFDB.